Most surveys get ignored. The average email survey response rate sits around 20%, and for link-based surveys it drops as low as 6–15%. The gap between a survey that gets completed and one that gets skipped usually comes down to a handful of decisions you make before anyone sees the first question.
These nine tactics are backed by benchmark data and controlled experiments.
To improve survey response rates, shorten the survey to under 5 minutes, move it from email links to in-app or SMS, and trigger it at a specific moment such as post-purchase or post-support. These three structural decisions move the number more than any copy or design tweak. Add one or two reminders and close the loop publicly to lift response on every survey that follows.
9 ways to improve survey response rates
1. Shorten the survey
Survey length has the strongest experimental evidence of any tactic. In a randomized controlled trial of survey length, the ultrashort version achieved a 64% response rate versus 51% for the long version. Across vendor benchmarks, response also drops sharply once a survey exceeds roughly 12 questions or 5 minutes.
Every question you remove is a question more people will answer.
Before sending, audit your question list. Cut anything you do not have a specific plan to act on. If you need detailed data, consider splitting your questionnaire — send different subsets of questions to different user segments and combine the results.
Best for: All survey types. The highest-return change for most teams.
2. Switch to in-app or SMS
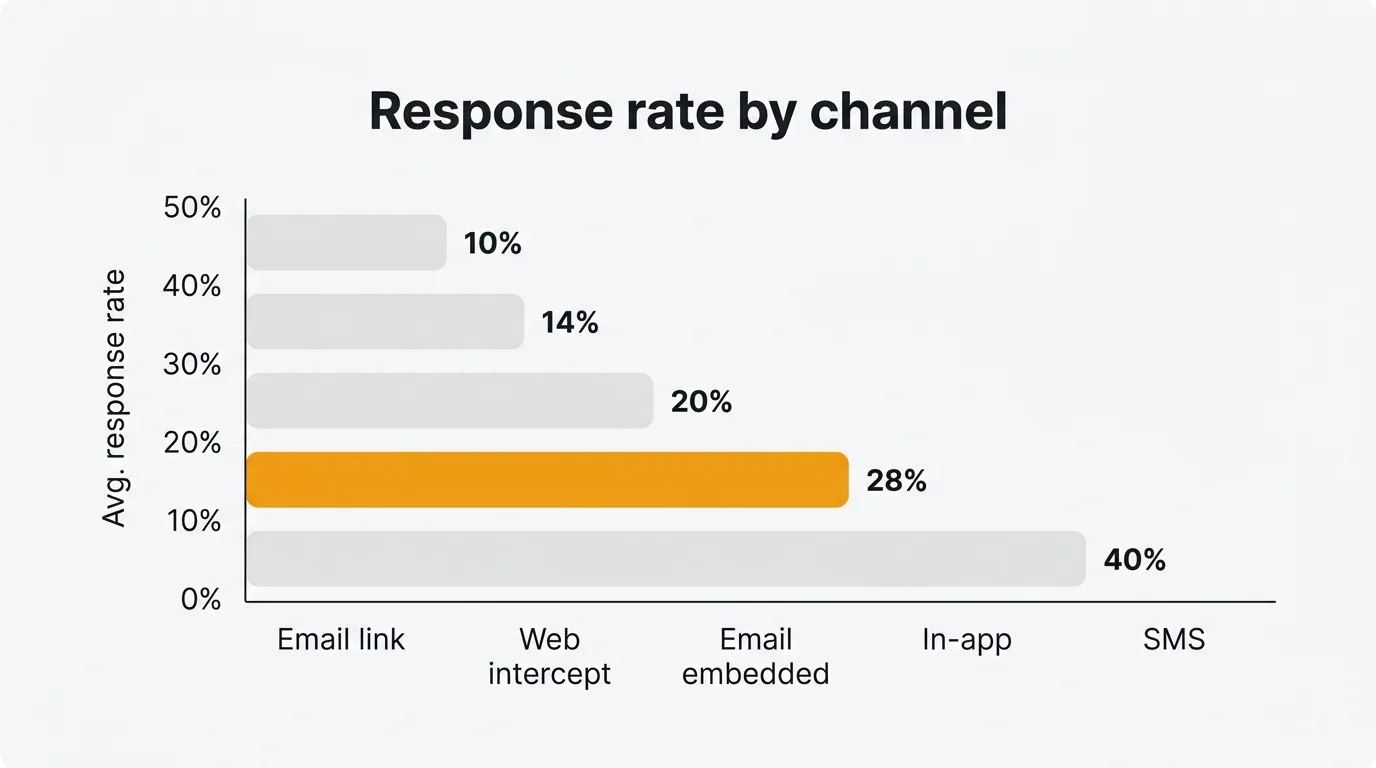
Channel choice has a larger effect than any copy or design change you can make. Benchmarks for 2025–2026:
| Channel | Typical response rate |
|---|---|
| SMS / text | 30–50% |
| In-app (embedded widget) | 25–35% |
| Email (embedded, one-click) | 15–25% |
| Email (link to external page) | 6–15% |
| Web intercept / pop-up | 8–20% |
If you are sending a link-based email survey and wondering why response is low, the channel itself is a large part of the problem. In-app surveys — shown to users while they are actively using your product — remove the friction of opening a new tab, loading a page, and reconstructing context for an interaction they have already moved on from.
Tools like the Quackback in-app widget let you collect NPS, CSAT, and open-ended feedback directly inside your product, where response rates are consistently 2–4× higher than equivalent email link surveys. Because Quackback is open source and free to self-host, you can put the widget in front of every user.
Best for: Any team that has flexibility over which channel they use.
3. Embed rather than link
Even within email, presentation matters. An embedded one-click NPS (where users click their score directly in the email body) typically gets 15–25% response. A link to an external survey page drops to 6–15%.
Each additional step — click, new tab, page load, possible re-authentication — loses a meaningful share of respondents. For short transactional surveys like NPS or CSAT, embed the first question directly in the email and collect the rest on the confirmation page after the click.
Best for: Email-based NPS, CSAT, and CES surveys.
4. Send 1–2 well-timed reminders
A single reminder sent 3–5 days after the original invitation typically adds 20–40% more responses. A second reminder at day 7 adds more again. After two reminders, returns diminish sharply.
Reminders increase volume but do not reliably change who responds — so if representativeness matters, they help but are not a complete fix.
Keep reminders short. Do not resend the full original message. Acknowledge you already reached out, state why the response matters in one sentence, and give a direct link.
Best for: One-time research surveys, annual NPS programs.
5. Mobile-optimize
More than half of survey responses now come from mobile devices. Mobile-optimized surveys show roughly 10% higher completion rates compared to desktop-first designs. Conversational-style mobile surveys — one question at a time, large tap targets, no grid questions — can reach 80–85% completion in well-designed flows.
The practical checklist before sending: test on a real phone, use a single-column layout, remove all matrix/grid questions (they are nearly unusable on small screens), keep text fields optional or short.
Best for: Consumer surveys, post-purchase NPS, any survey distributed via SMS or in-app notification.
6. Time it to the moment of truth
The highest-converting surveys are triggered by a specific event: completing a purchase, finishing an onboarding flow, resolving a support ticket, reaching a usage milestone. Event-triggered surveys consistently outperform batch campaigns sent to your entire user base on a fixed schedule.
Timing within the event matters too. A post-support survey sent within an hour of ticket closure out-performs one sent the following morning. Users still have the experience in mind and give more accurate, more useful feedback.
The Quackback feedback widget supports event-triggered prompts — you can fire a survey at any point in your product flow without code changes on every release. See the docs for how to wire triggers into your existing events.
Best for: Product teams, customer success, post-support workflows.
7. Personalize the invitation
Personalized email subject lines increase open rates by roughly 26%, which directly improves how many people see your survey invitation. Beyond the subject line: address recipients by name, reference the specific interaction or product they used, and explain in one sentence what you will do with the results.
Generic subject lines like "Share your feedback" perform significantly worse than "How was your onboarding last Tuesday?" — not because of the name, but because of the specificity. Specificity signals that this is a real request, not an automated blast.
Best for: Email-distributed surveys where you have contact data and interaction history.
8. Use prepaid incentives for critical research
For surveys where data quality is essential — pricing research, feature prioritization, hard-to-reach segments — monetary incentives can nearly double response rates. The key distinction: prepaid (unconditional) incentives outperform post-survey rewards or sweepstakes entries.
A small guaranteed reward outperforms a much larger sweepstakes prize in most experiments. A meta-analysis of 46 randomized controlled trials found prepaid cash incentives substantially outperform both conditional rewards and lotteries. Sweepstakes are low-cost but largely ineffective; small guaranteed rewards reliably shift behavior.
The trade-off: incentives can shift sample composition, changing who responds. If you use them, note this when interpreting results and consider whether the shift matters for your specific question.
Best for: B2B surveys, hard-to-reach segments, high-stakes research where completion rate is the priority.
9. Close the loop publicly
If users do not believe their feedback leads to anything, they stop participating. Publicly acknowledging what you heard and what you changed is the most durable long-term investment in response rates.
A public changelog that references user feedback — "We added X because users asked for it in our Q1 survey" — signals that participating is worth the effort. Teams that close the loop consistently report higher response rates on subsequent surveys. An MCP server makes this loop easier to run: you can query, triage, and link feedback to shipped work directly from the AI tools you already use, so acting on responses does not depend on manual exports.
This is also the tactic that separates feedback programs from feedback theater. Closing the loop turns a one-way data collection exercise into a conversation.
Best for: Product teams running recurring feedback programs, NPS follow-up workflows.
Which tactics to prioritize
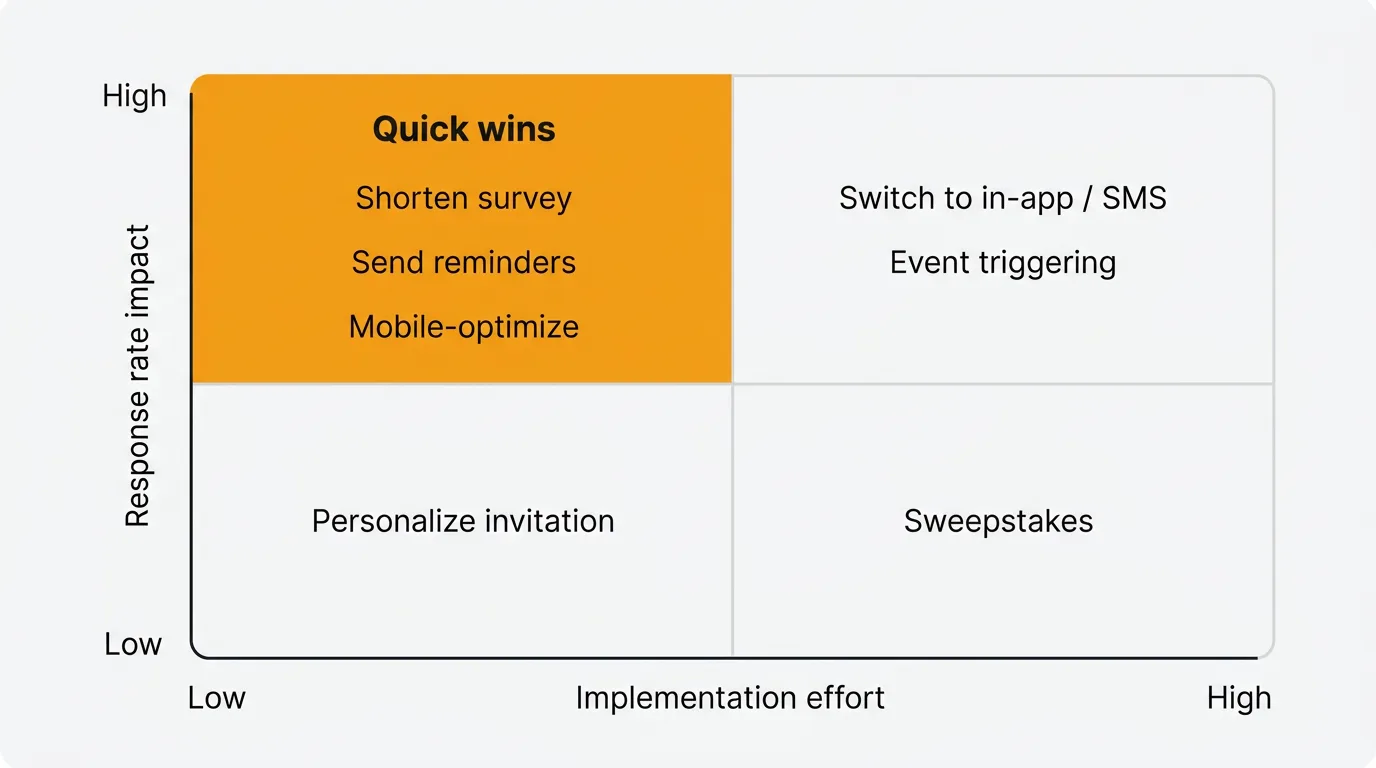
Mapped by impact and effort, the nine tactics fall into four quadrants:
- High impact, low effort (do first): shorten the survey, add one or two reminders, mobile-optimize.
- High impact, higher effort: switch to in-app or SMS, time surveys to a specific event.
- Lower impact, low effort: embed rather than link, personalize the invitation.
- Situational: prepaid incentives for critical research, close the loop publicly as a long-term investment.
Start with the top-left: shortening your survey, adding a reminder, and mobile-optimizing are all low-effort changes that produce measurable lifts. These are the right first moves for any team.
Then address channel if you have flexibility. Moving from email links to in-app or SMS is the highest-impact structural change most product teams can make.
Incentives are worth considering if you need specific data from a hard-to-reach segment or a one-time critical study. Skip sweepstakes unless you have a specific reason to run one.
What counts as a good survey response rate
A good survey response rate is roughly 20% or higher for email link surveys, 30% or higher for embedded email, and 40% or higher for in-app or SMS surveys, though the right benchmark depends heavily on channel and audience. Rough benchmarks for 2025–2026:
| Survey type | Typical | Strong |
|---|---|---|
| Email, link-based | 6–15% | 20%+ |
| Email, embedded | 15–25% | 30%+ |
| In-app / SMS | 25–40% | 50%+ |
| B2B relationship survey | 10–15% | 25%+ |
| B2C transactional NPS | 20–35% | 40%+ |
If you are below the typical range for your channel, audit length and timing first — these have bigger effects than question wording or visual design. If you are choosing a feedback tool to run these surveys, our Quackback vs Canny and Quackback vs Featurebase comparisons cover how in-app collection and pricing differ across the main options.
Common mistakes that kill response rates
- Sending too late. A weekly batch job that sends post-purchase surveys 5–6 days later will consistently underperform a trigger that fires within the hour.
- Requiring a new login or account. Every additional authentication step loses a significant share of respondents before they see question one.
- Asking for more than you will act on. Users learn quickly when feedback goes nowhere. A 10-question survey where you act on 9 answers beats a 30-question survey where you act on 3.
- No mobile testing. Grid questions on mobile are nearly unusable. Test on a real device before you send to thousands of users.
- Re-surveying too soon. Survey fatigue is real. Wait at least 90 days before re-contacting the same user unless they have had a distinct new interaction.
Try Quackback — open source with a managed cloud option. Start free. Get started | View on GitHub
Frequently asked questions
What is a good survey response rate?
For email link-based surveys, 15–20% is typical and 25%+ is strong. For in-app and SMS surveys, 25–40% is achievable in well-run programs. B2B surveys average 10–15%. Focus on your own trend over time rather than absolute benchmarks — a consistent upward trend matters more than hitting a specific number.
How many reminder emails should I send?
One or two. The first reminder sent 3–5 days after the original invitation typically adds the most incremental responses. A second at day 7 adds some more. After that, diminishing returns set in quickly and you risk signal from annoyance rather than genuine engagement.
Does survey length really matter that much?
Yes — it is the tactic with the strongest controlled experimental evidence. Moving from a 15-minute survey to a 5-minute survey can increase response by 10–25 percentage points. Keep surveys to 7–10 questions for transactional contexts, 15–20 for research contexts where respondents have chosen to participate.
Should I offer a prize to increase responses?
Sweepstakes (one large prize) have weak evidence behind them. Prepaid incentives (small guaranteed rewards given before completion) have strong evidence and can roughly double response rates in some studies. If you are running a critical one-time study, a guaranteed $5–10 reward is more effective than a $500 sweepstakes.
How much does channel choice affect response rates?
More than any other single factor after survey length. SMS and in-app surveys typically achieve 25–50% response. Email link surveys typically achieve 6–15%. If you are on email links and want to improve response, switching to in-app or embedded email is the highest-impact structural change available.
Authored by James Morton
Founder of Quackback. Building open-source feedback tools.
Try Quackback
The open-source feedback platform. Boards, voting, and roadmaps.
Get startedStar on GitHub132